I recently had to investigate a performance issue in some code, and I used Trace Parser to identify the problem.
Trace Parser is an extremely useful tool in D365FO when you need to understand where execution time is actually spent, especially when traditional debugging is not sufficient. (Official Microsoft documentation)
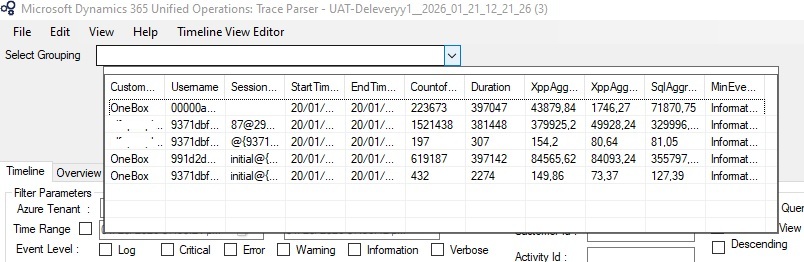
I started by recording a trace in the application while running the process where I experienced the performance issue. After importing the trace into Trace Parser, the first step was to select the correct grouping.
If the trace contains multiple groupings, it can be a bit difficult to know which one to choose. I usually start with the grouping that has the highest values in CountOf or Duration, as that often points to the most expensive execution paths.
Analyzing the Call Tree
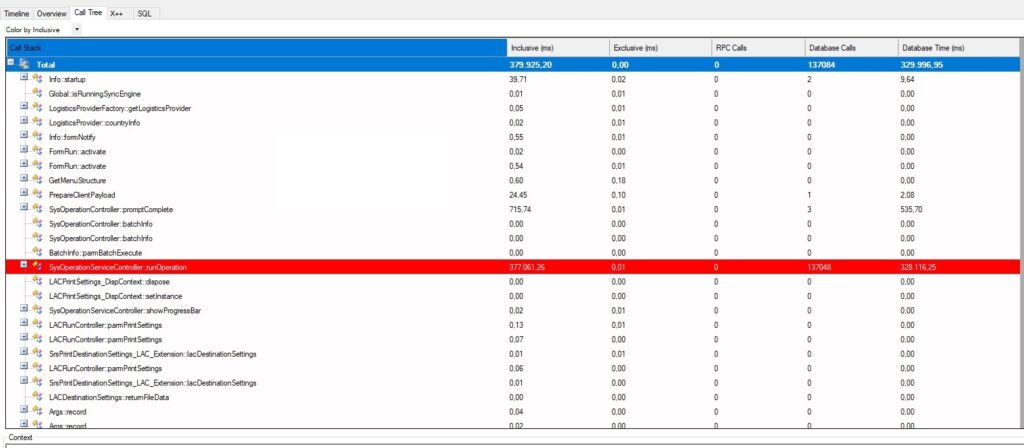
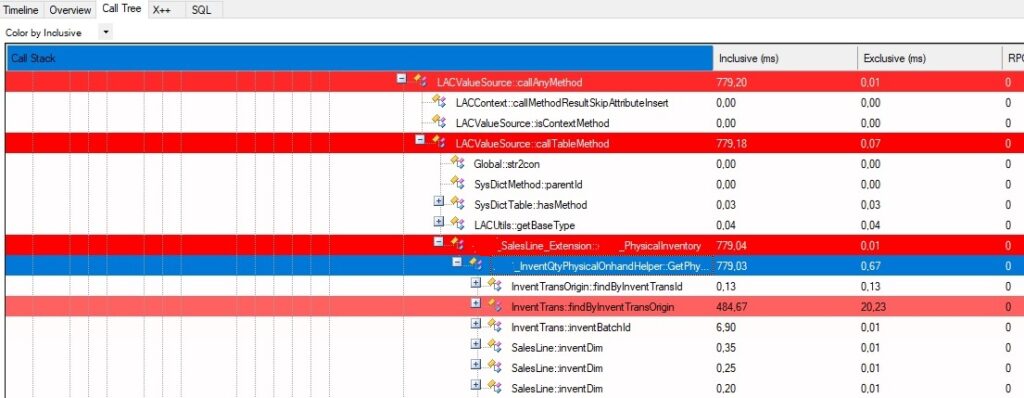
Next, I switch to the Call Tree view and look for methods with a high Inclusive (ms) value.
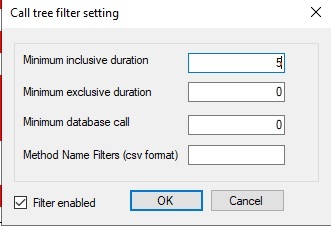
Sometimes it helps to apply a filter to reduce noise. I have found that setting “Minimum inclusive duration” to 5 filters out many of the less interesting entries and makes it easier to focus on the real problem areas.
I have also experimented with Method Name Filters, but in my experience they do not work as intuitively as expected, so I usually do not rely on them.
Finding the Problematic Method
From here, I simply keep expanding the entries highlighted in red until I reach the method that appears to perform poorly.
In this case, the issue turned out to be a method called PhysicalInventory in a custom class.
Analyzing Performance Outside the Dev Environment
One of the major advantages of using Trace Parser is that you are not limited to tracing performance issues on your local dev box.
Because traces can be recorded directly in the application, you can also capture traces from other environments, such as a customer’s test environment or even production (when done carefully).
This makes Trace Parser especially useful for diagnosing performance issues that are difficult or impossible to reproduce locally, and allows you to analyze real-world execution paths and data volumes.
Conclusion
Using Trace Parser makes it much easier to pinpoint real performance bottlenecks instead of guessing. By focusing on Inclusive duration and carefully expanding the call tree, you can often identify problematic custom code very quickly.
Quick Tips
– Always record the trace on the slowest scenario
– Focus on Inclusive time, not Exclusive
– Be patient when expanding the call tree — the problem is often deeper than expected
Further reading
If you are new to Trace Parser or want a practical walkthrough of how to capture and analyze traces in D365FO, the following blog posts provide step-by-step guides based on real-world usage:
songnghia.com – Using Trace Parser as a Debugger in D365FO
A detailed, practical walkthrough of trace capture, import, and analysis, including Call Tree and X++ execution paths.
SainaCloud – How to use Trace Parser in D365 FO
Covers how to start a trace from the D365FO UI, download it, and import it into Trace Parser for analysis.